THEORY, DEFINITIONS
Potential vegetation
Potential Natural Vegetation (PNV) – or, briefly, potential vegetation – is the vegetation that in the present abiotic environmental conditions can sustain itself permanently without any human intervention (Tüxen 1956). Hence, PNV is
- a self-sustainable state of vegetation without human effects;
- able to survive, so it is not a prerequisite that it can form by spontaneous succession at the site in question, for example in case of abandonment of current land use. Neither is propagule availability tested.;
- applies to the present period, thus it is not equivalent to the prehuman vegetation (i.e. vegetation before human's landscaping activity). For a more complete interpretation of Tüxen's original definition and analysis of later interpretations, please refer to Somodi et al. (2012).
Prehuman vegetation
Prehuman vegetation is a vegetation prior to man's landscaping activity, reflecting the environmental conditions at that time. Exceptionally, they may be consistent with current environmental conditions, but on most part of the Earth's surface, human landscaping activities have taken place for so long that environmental conditions have changed meanwhile. On the one hand, the climate changes over time without any human influence, and we know it has already changed. Climate change induces changes of soils and, in the long term, even of the hydrography. On the other hand, humans modify their environment in a direct way, which in particular changes the availability of water resources, but also indirectly affects the climate. Consequently, the former and present environmental conditions are typically different. But even if they were the same, prehuman vegetation characterizes the realized state, while the potential vegetation of that time could have encompassed a wider selection of vegetation types. As opposed to prehuman vegetation, models of potential vegetation can become a more appropriate source of information for nature conservation and restoration ecology, since restoring the habitats of the past is in many cases no longer a realistic restoration objective (Jackson and Hobbs 2009) as well as it does not ensure sustainability.
Multiple potential natural vegetation (MPNV)
 In earlier PNV estimations usually a single vegetation type was selected per location. Approaches ranged from inherently categorical methods (Fischer 1990, Aspinall and Veith 1993, Fischer et al. 2013), through rule-based methods (Hemsing and Bryn 2012) to a selection of vegetation types that received the highest probability at each location (Breziecki et al. 1993, Tichy 1999, Liu et al. 2009). At the same time, in reality, a number of different habitats can be potentially present (albeit not necessarily with the same probability). Hence, one place can have more PNVs - because the same environmental conditions may be suitable for several habitats. It can therefore be argued that mapping solely the most likely vegetation type results in a loss of information regarding the local vegetation potential. This is in accordance with
- varying degrees of similarity have been found among vegetation units and that they can not be viewed as categorical but rather as a fuzzy set therefore (e.g. Roberts 2015);
- multiple stable states having been described from undisturbed environmental settings, i.e. succession is stochastic (e.g. Baker and Walford 1995, Petraitis 2013).
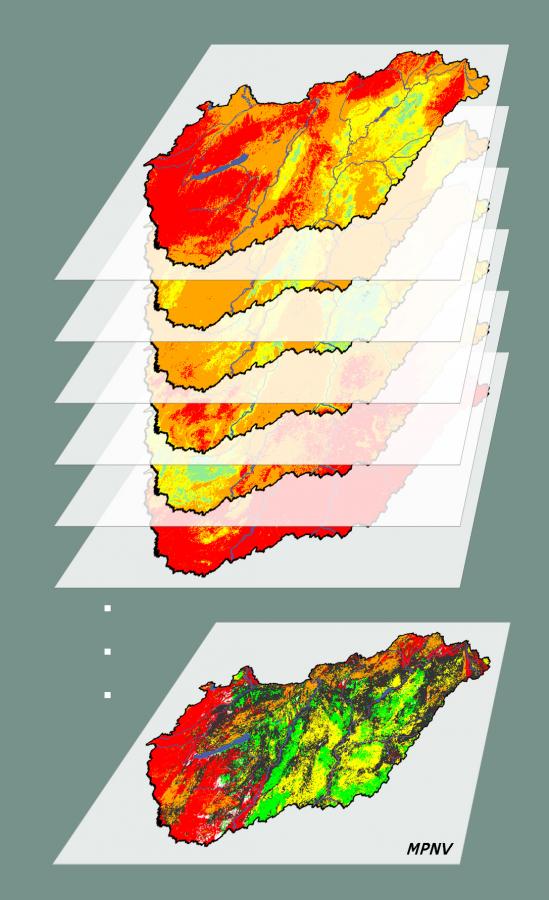
The concept of Multiple Potential Natural Vegetation (MPNV) was introduced by Somodi et al. (2012) to resolve this apparent contradiction. MPNV accounts for estimation uncertainty by assigning a probability value to each vegetation type rather than declaring the most likely PNV. Since MPNV estimates are complex, there are many different possibilities to display the results in map. For more information on the ecological interpretation and modeling possibilities of MPNV, please refer to our article on the scientific background of the estimates available at this site (Somodi et al. 2017).
RELATED CONCEPTS
The concepts related to the above one are as follow:
- Potential Site-adapted Vegetation (PSV, Leuschner, 1997) also takes into account the secondary habitats possibly settling in the environmental conditions (mostly related to water balance and soil) changed by humans;
- Potential Replacement Vegetation (PRV) can develop in a location given continuous anthropogenic interventions (e.g. mowing, Chytrý 1998). Certain interpretations suggest that PRV may also involve human-induced invasive processes (Chytrý 1998, Somodi et al. 2012);
- Potential Future Natural Vegetation (PFV), potential natural vegetation in a given future time point, may incorporate the condition of development by succession (Somodi et al. 2012).
MODELING
Modeling approach
 In Hungary, human landscaping has been going on for many years now, and for ahigh number of places there are no written sources available about the type of the past vegetation. Moreover, partly for human, partly for natural reasons, today's environmental conditions are no longer the same in the currently unvegetated or degraded areas as they were when the area was last covered by natural vegetation. Therefore, we have to rely on some estimation. The estimate may be based on an expert's experience accumulated during his life or on statistical estimations. An example of the former is the first such estimate for Hungary: Bálint Zólyomi's potential vegetation map (Zólyomi 1967). This is a map where the author has tried to reconstruct the vegetation that could cover the country before human influences. This is also a potential vegetation map but it is difficult to specify the timeline it applies to as environmental conditions taken into account by Zólyomi have partially been contemporary, partially reconstructed. Another example for expert estimation is the potential habitat data found in the MÉTA database, which reflects the field mapper's view under the current environmental conditions (Molnár et al. 2007). However, maps based on expert estimates can not be extrapolated in time or space, as opposed to estimates and models based on statistical contexts.
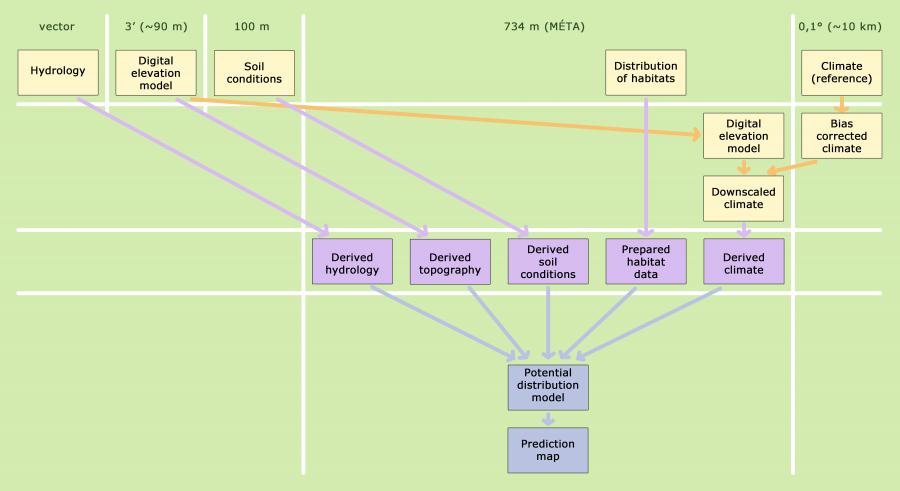
The basis of the published model is the statistical formalization of the relationships observed between the remaining natural habitats and their abiotic environment (for a more detailed description of the methodology please refer to Somodi et al. 2017 and Bede-Fazekas 2017). Habitat information was obtained from the MÉTA database. We selected natural habitats that represent the final stages of the natural development of the vegetation (succession). The abiotic environment is represented by different background variables. Most of them characterize climate, such as annual precipitation sum or mean summer temperature, but the background variables include a topographic feature as well. In addition, soil characteristics and the distance taken from different water bodies (lakes and rivers) were taken into account.
Training of the model
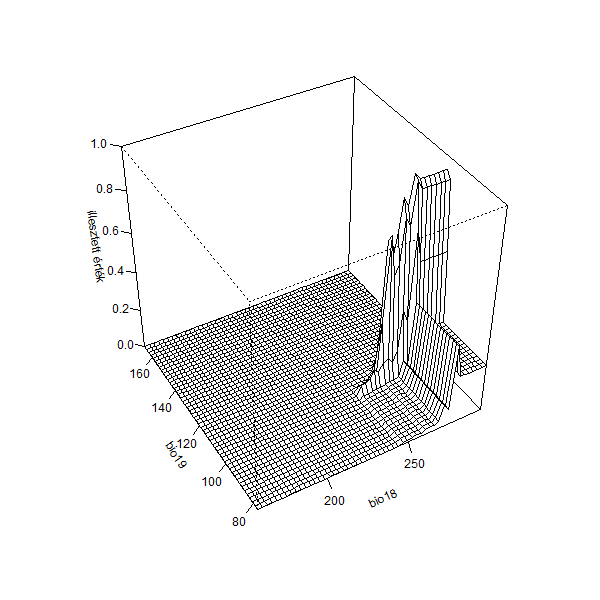
We built a separate model for each studied habitat, and environmental data from the 1977-2006 reference period were used to train the models. Building models is a step independent of prediction. Among the many possible modeling approaches, our choice has fallen on the Boosted Regression Trees method (BRT, Friedman et al. 2000, Friedman 2002, Schapire 2003). The use of BRT as a predictive ecological model is relatively new (De'ath 2007, Elith et al. 2008). However, several studies have pointed out their outstanding predictive power (Elith et al. 2006, Bühlmann and Hothorn 2007, Guisan et al. 2007a). It can be used well with high correlation among the predictor variables (Bühlmann and Hothorn 2007, Ogutu et al. 2011) if the correlation structure between the training and the prediction database does not differ significantly (Dormann et al. 2013). It is less sensitive to data errors (Graham et al. 2008) and the resolution of training data (Guisan et al. 2007b).
Prediction
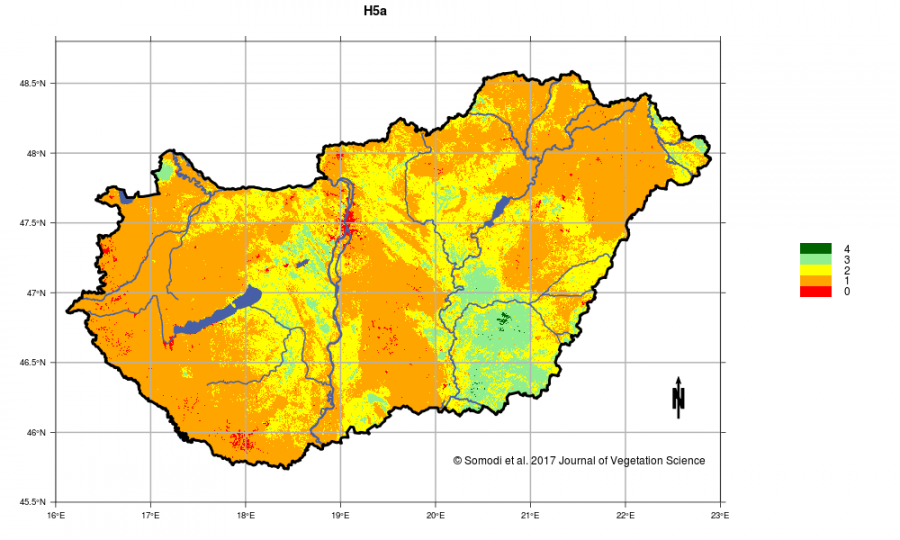 The main result of statistical modeling is the map series of the possible distribution of modeled habitats, which in turn provides Hungary's potential vegetation map. A map depicts how likely a given habitat occurs at a certain point in the country. Based on these, we can determine how larger a habitat's distribution could be, and where patches could be present if human activities had not taken place. This can support spatial planning in nature conservation and habitat restoration works by finding the most promising locations on the basis of the potential presence of the habitat. Potential distribution of specific habitats can be represented by probabilities between 0 and 1. These are able to characterize the potential distribution within the country in the most accurate way. If this raw probability value is somewhere twice higher than elsewhere, then the habitat is twice as suitable for the area. However, this not true for between-habitat comparison, because the absolute probabilities of each habitat depend on the habitat characteristics (biological and statistical, e.g. prevalence). Therefore, the probability values were converted to a five-level ordinal scale of 0 to 4 in a way to ensure comparability, where the highest value means the highest probability of occurrence. These ordinal values are displayed on the maps available on the website and are made accessible through the MÉTA database. (If appropriate, raw probabilities can be obtained through the authors.)
REFERENCES
 The above information is from the publications below. See details there:
- Bede-Fazekas Á (2017): Fás szárú dísznövények potenciális telepíthetőségi területének előrejelzése természetközeli élőhelyekre készített modellek alapján. Doktori értekezés. Szent István Egyetem, Tájépítészeti és Tájökológiai Doktori Iskola, Gödöllő.
- Somodi I, Molnár Zs, Ewald J (2012): Towards a more transparent use of the potential natural vegetation concept – an answer to Chiarucci et al.. Journal of Vegetation Science 23(3): 590–595.
- Somodi I, Molnár Zs, Czúcz B, Bede-Fazekas Á, Bölöni J, Pásztor L, Laborczi A, Zimmermann NE (2017): Implementation and application of Multiple Potential Natural Vegetation models – a case study of Hungary. Journal of Vegetation Science 28(6): 1260-1269.
Cited literatures:
- Aspinall R, Veitch N (1993): Habitat mapping from satellite imagery and wildlife survey data using a Bayesian modeling procedure in a GIS. Photogrammetric Engineering and Remote Sensing 59: 537–543.
- Baker WL, Walford GM (1995): Multiple Stable States and Models of Riparian Vegetation Succession on the Animas River, Colorado. Annals of the Association of American Geographers 85: 320–338.
- Breziecki B, Kienast F, Wildi O (1993): A simulated map of the potential natural forest vegetation of Switzerland. Journal of Vegetation Science 4: 499–508.
- Bühlmann P, Hothorn T (2007): Boosting algorithms: regularization, prediction and model fitting. Statistical Science 22(4): 477–505.
- Chytrý M (1998): Potential replacement vegetation: An approach to vegetation mapping of cultural landscapes. Applied Vegetation Science 1(2): 177–188.
- De’ath G (2007): Boosted trees for ecological modeling and prediction. Ecology 88(1): 243–251.
- Dormann CF, Elith J, Bacher S, Buchmann C, Carl G, Carré G, García Marquéz JR, Gruber B, Lafourcade B, Leitão PJ, Münkemüller T, McClean C, Osborne PE, Rfeineking B, Schröder B, Skidmore AK, Zurell D, Lautenbach S (2013): Collinearity: a review of methods to deal with it and a simulation study evaluating their performance. Ecography 36(1): 27–46.
- Elith J, Graham CH, Anderson RP, Dudík M, Ferrier S, Guisan A, Hijmans RJ, Huettmann F, Leathwick JR, Lehmann A, Li J, Lohmann LG, Loiselle BA, Manion G, Moritz C, Nakamura M, Nakazawa Y, Overton JMM, Peterson AT, Phillips SJ, Richardson K, Scachetti-Pereira R, Schapire RE, Soberón J, Williams S, Wisz MS, Zimmermann NE (2006): Novel methods improve prediction of species’ distributions from occurrence data. Ecography 29(2): 129–151.
- Elith J, Leathwick JR, Hastie T (2008): A working guide to boosted regression trees. Journal of Animal Ecology 77(4): 802–813.
- Fischer HS (1990): Simulating the distribution of plant communities in an alpine landscape. Coenoses 5: 37–43.
- Fischer HS, Winter S, Lohberger E, Jehl H, Fischer A (2013): Improving transboundary maps of potential natural vegetation using statistical modeling based on environmental predictors. Folia Geobotanica 48: 115–135.
- Friedman JH, Hastie T, Tibshirani R (2000): Additive logistic regression: a statistical view of boosting. The Annals of Statistics 28(2): 337–407.
- Friedman JH (2002): Stochastic gradient boosting. Computational Statistics & Data Analysis 38(4): 367–378.
- Graham CH, Elith J, Hijmans RJ, Guisan A, Peterson AT, Loiselle BA, NCEAS PSDWG (2008): The influence of spatial errors in species occurrence data used in distribution models. Journal of Applied Ecology 45(1): 239–247.
- Guisan A, Zimmermann NE, Elith J, Graham CH, Phillips S, Peterson AT (2007): What matters for predicting the occurrences of trees: techniques, data or species’ characteristics? Ecological Monographs 77(4): 615–630.
- Guisan A, Graham CH, Elith J, Huettmann F, NCEAS SDMG (2007b): Sensitivity of predictive species distribution models to change in grain size. Diversity and Distributions 13(3): 332–340.
- Hemsing LØ, Bryn A (2012): Three methods for modelling potential natural vegetation (PNV) compared: A methodological case study from south-central Norway. Norsk Geografisk Tidsskrift – Norwegian Journal of Geography 66: 11–29.
- Jackson ST, Hobbs RJ (2009): Ecological restoration in the light of ecological history. Science
325(5940): 567–569. - Leuschner C (1997): Das Konzept der potentiellen natürlichen Vegetation (PNV): Schwachstellen und Entwicklungsperspektiven. Flora 192(1): 379–391.
- Liu H, Wang L, Yang J, Nakagoshi N, Liang C, Wang W, Lv Y (2009): Predictive modeling of the potential natural vegetation pattern in northeast China. Ecological Research 24: 1313–1321.
- Molnár Zs, Bartha S, Seregélyes T, Illyés E, Botta-Dukát Z, Tímár G, Horváth F, Révész A, Kun A, Bölöni J (2007): A grid-based, satellite-image supported, multi-attributed vegetation mapping method (MÉTA). Folia Geobotanica et Phytotaxonomica 42(3): 225–247.
- Ogutu JO, Piepho H-P, Schulz-Streeck T (2011): A comparison of random forests, boosting and support vector machines for genomic selection. BMC Proceedings 5(Suppl. 3): S11.
- Petraitis P (2013): Multiple stable states in natural ecosystems. OUP Oxford.
- Roberts DW (2015): Potential natural vegetation and environment: a critique of Kusbach, Shaw & Long. Applied Vegetation Science 18: 733–738.
- Schapire R (2003): The boosting approach to machine learning – an overview. In: Denison DD, Hansen M, Holmes C, Kohn R, Mallick B, Tanner M, Yu B (szerk.): MSRI Workshop on Nonlinear Estimation and Classification. Berkeley, CA, USA: Mathematical Sciences Research Institute.
- Tichy L (1999): Predictive modeling of the potential natural vegetation in the Podyjí National Park, Czech Republic. Folia Geobotanica 34: 243–252.
- Tüxen R (1956): Die heutige potentielle natürliche Vegetation als Gegenstand der Vegetationskartierung. Angewandte Pflanzensoziologie (Stolzenau) 13: 4–42.
- Zólyomi B (1967): Rekonstruált növénytakaró. In: Radó S (szerk.): Magyarország nemzeti atlasza. Budapest: Kartográfiai Vállalat.